In this section...
Sweetie Maths? Yes Please!
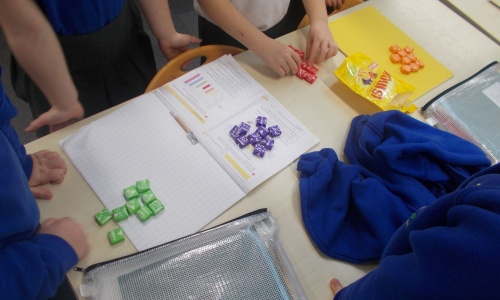
As part of our bar graph unit, we asked children at home to get smarties or starburst to create their own bar graph. The children at school has starburst to complete a bar graph.
They had to collate the data and then create the X axis and the Y axis. They decided what scale to use and how to label the two lines of axis.
We are very proud of the level of presentation and determination shown by the children in school and at home.